
Why 2 degrees Celsius matters
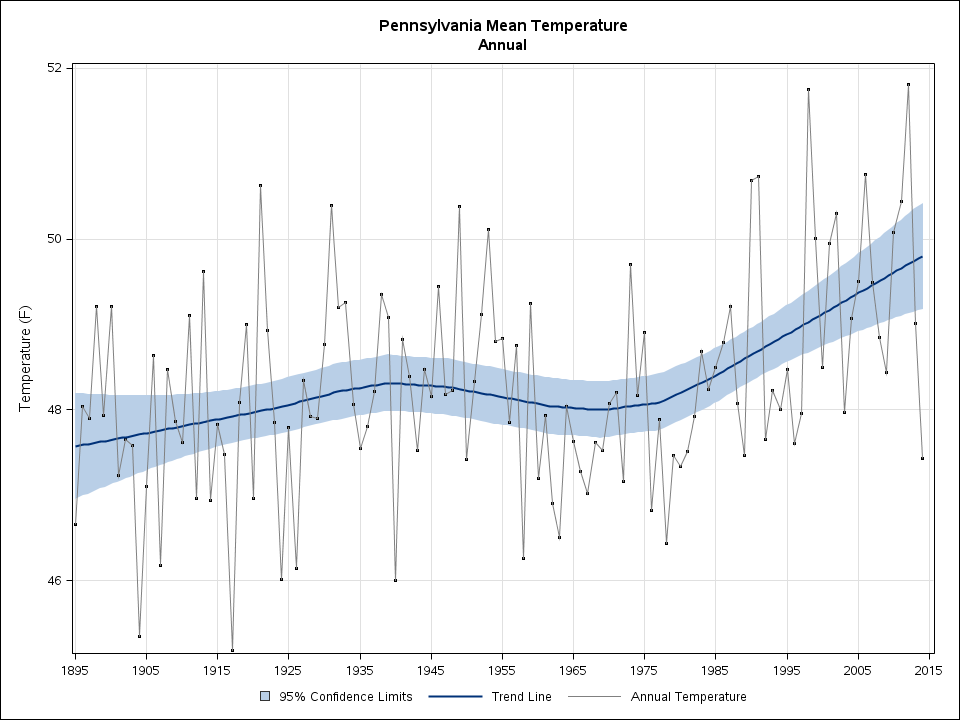
I start the discussion in class of temperature changes with using the Image of the Day exercise in the PAESTA Classroom. I use the image of Pennsylvania Mean Temperature (link is external) from NOAA (search for Pennsylvania on the NOAA (link is external) site if PA doesn't come up directly - the image is also part of the Supporting Files with this entry). Students practice reading data from the graph and then discuss what the data mean. Students are surprised to see that there has been an almost two-degree Fahrenheit increase in temperature in Pennsylvania since 1975.
This has always led to an interesting discussion with the students - what difference does two degrees really make? I show them this PBS News Hour video that summarizes the COP21 United Nations Conference on Climate Change (link is external) that took place in Paris in late 2015, and then I encourage them to view the following videos produced by National Geographic on what would happen to our planet with a one-degree temperature rise, and then a two-degree temperature rise. (*Note that the NOAA graph uses Fahrenheit, while the COP21and global reports are based on Celsius)
You can view all of the National Geographic videos for one degree (link is external), two degrees (link is external), three degrees (link is external), four degrees (link is external), five degrees (link is external), and six degrees (link is external).
We hear all the time that we need to stop the planet from warming an additional two degrees Celsius above pre-industrial levels. Why is that specific number so important though? And what happens if we exceed that limit? PBS News Hour offers some background on that climate science target (this is a complete transcript (link is external) for the video).
The National Geographic videos are from 2008 and describe the global impact of the planet warming one degree at a time.
| Attachment | Size |
|---|---|
| 63.31 KB |