Favorite Videos

As teachers, we like to show video clips of varying lengths to our students to introduce a new content, to enforce a concept, or to take students to locations across the globe. Videos can engage students, spark a conversation, demonstrate laboratory experiments, and so much more.

To submit your favorite videos, login to your PAESTA account and select 'Contribute' then 'Digital Resource' from the top menu.


Leave blank for all.
Embedded thumbnail for El Niño and La Niña Explained

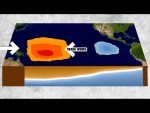
This video is from the NOAA Ocean Today collection. The video explains and shows the interaction between the trade winds, surface ocean movement, jet stream, and the climatic impacts. What this video shows that is not found in other videos is a map view and cross sectional view of the Pacific Ocean basin, demonstrating the trade winds blowing the warm water to the western Pacific at the same time the upwelling of the colder water is occurring in the eastern Pacific.

Corrosive Chemistry: How Lead Ended Up in Flint's Drinking Water

This animation is part of Scientific American's 60-Second Science series (although the video is two minutes in length). A complete transcript for the video is online, with the video also embedded at the link.

You can also view a webpage with just the video (no supporting text).

Embedded thumbnail for Minute Physics:  Why is the Solar System Flat?

Many of the Minute Physics videos are good, but I like this one in particular because it is the best resource I have found for this challenging concept.  They show an excellent computer simulation of a cloud of gas that represents the Solar Nebula collapsing to form a proto-planetary disk.  This is a concept illustrated in just about every introductory astronomy textbook, but it is almost impossible to get the details right in an illustration.

Embedded thumbnail for Is There Poop on the Moon? (Minute Physics)

As science teachers, one of our primary goals is to create ideal conditions for students to grow their content knowledge and skills in science.  But often students come into our classrooms with misconceptions that get in the way.  Sometimes we need to bust the false knowlege our students have acquired before we can really get them to reach deep levels of understanding of important scientific concepts.

Embedded thumbnail for What if the Sun Disappeared? (Vsauce)

There is so much to like in this eleven minute video: physics, biology, chemistry, geology, and some wild and fantastic scientific speculation!  Add to that a curiously captivating and eccentric narrator named vsauce, and you have the ingredients for a great warm-up video to a discussion of the solar system and the importance of the sun to Earths  biosphere.

Embedded thumbnail for Pale Blue Dot - By Carl Sagan

This one pretty much speaks for itself.  I had the honor of listening to Carl speak in person once, during a Planetary Society event following the impact of Shoemaker-Levey-9 into Jupiter.  He was every bit the science star I belived him to be.  He helped ignight my love of science with his Cosmos book and series.  This audio clip from his book "Pale Blue Dot" is read by Carl himself, and is shown to my students every Earth Day.

I ask my students to see how many epic movie clips they recognize.  The answer gets smaller every year!

Embedded thumbnail for Keeling's Curve – The Story of CO2

This video is from the American Museum of Natural History's Science Bulletins collection. "As the leading greenhouse gas, carbon dioxide is one of the atmosphere’s most closely watched ingredients. The scrutiny began in 1958, when a young geochemist named Charles Keeling began regularly measuring CO2 atop a massive Hawaiian volcano—and discovered some intriguing patterns.

Embedded thumbnail for Weather Versus Climate Change

This video was published on May 28, 2014, as part of the Cosmos: A Spacetime Odyssey (link is external) series. In the video, Neil deGrasse Tyson breaks down the differences between weather and climate change through a simple walk with a dog. He discusses the differences in the length of time and scales of data that are examined to determine short-term fluctuations and long-term averages.

Embedded thumbnail for Coriolis Effect

Coriolis is not only difficult for students to master, it can be incredibly difficult to explain to students.  Below are a few excellent videos which explain the coriolis effect visually much better than I can on a chalkboard.


Embedded thumbnail for Finding the Slippery Slope: Detecting Landslides from Space

Dalia Kirschbaum, research physical scientist at NASA Goddard Space Flight Center, describes her research on natural hazard assessment using remotely sensed information during a presentation at the Library of Congress in Washington, DC.

Pages